Mondrian
Random Composition in Red, Blue, and Yellow
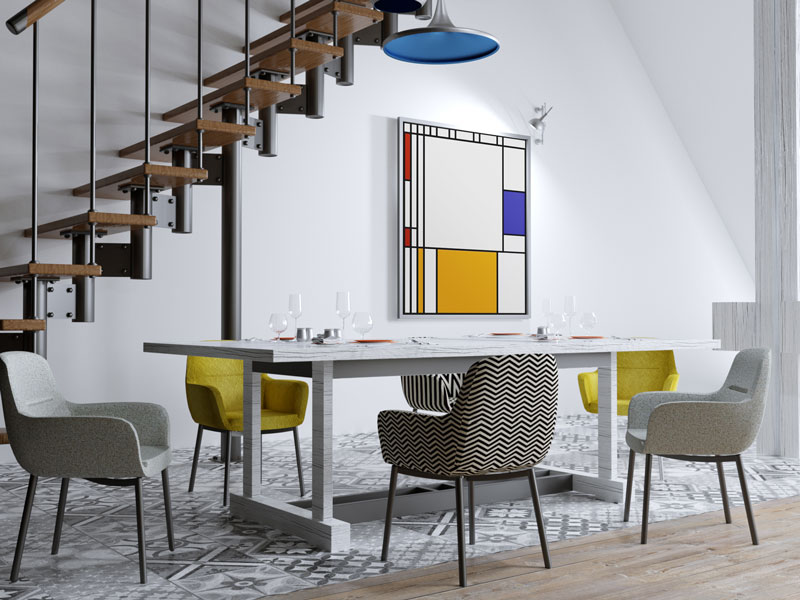
Piet Mondrian was a Dutch painter best know for his involvement in the artistic movement De Stijl or neoplasticism. De Stijl consisted of a white background, upon which Mondrian painted a grid of vertical and horizontal black lines and the three primary colors such as red, blue, and yellow. Some notible work by Mondrian include:


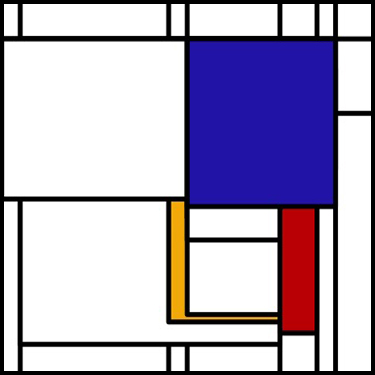
Such random compositions can also be generated computationally.
#' Generate a random art piece in the style of
#' Composition in Red, Blue, and Yellow by Piet Mondrian
#'
#' @param width Width of image (integer)
#' @param height Height of image (integer)
#' @param fixedLines Whether to use fixed line widths (boolean)
#' @param seed Set seed (integer or NA)
#'
#' @return plot
composition <- function(
  width=100, height=100,
  minDistApart=round(min(width, height)/20),
  fixedLines=FALSE, seed=NA) {

  if(!is.na(seed)) {
    set.seed(seed)
  }

  # set colors; red, yellow, blue, black, white
  colors <- c('#c70000', '#f4b600', '#2d2bb4', 'black', 'white')
  # more likely to sample white, least likely to sample black
  p <- c(0.15, 0.15, 0.15, 0.05, 0.5)

  # random number of horizontal and vertical lines
  # more likely to sample lower number
  nLinesX <- sample(2:floor(width/minDistApart), 1, p=1/(2:floor(width/minDistApart)))
  # make sure lines are not too close together
  x <- sample(1:floor(width/minDistApart), nLinesX)*minDistApart
  x <- sort(x)
  nLinesY <- sample(2:floor(height/minDistApart), 1, p=1/(2:floor(height/minDistApart)))
  y <- sample(1:floor(height/minDistApart), nLinesY)*minDistApart
  y <- sort(y)

  # set line width
  if(fixedLines) {
    lineWidthX <- rep(round(min(width, height)/20), nLinesX)
    lineWidthY <- rep(round(min(width, height)/20), nLinesY)
  } else {
    lineWidthX <- sample(round(min(width, height)/20):round(min(width, height)/5), nLinesX, replace=TRUE)
    lineWidthY <- sample(round(min(width, height)/20):round(min(width, height)/5), nLinesY, replace=TRUE)
  }

  # randomly decide whether to go to edge
  if(sample(c(TRUE, FALSE), 1)) {
    x <- c(0, x)
    lineWidthX <- c(0, lineWidthX)
  }
  if(sample(c(TRUE, FALSE), 1)) {
    x <- c(x, width)
    lineWidthX <- c(lineWidthX, 0)
  }
  if(sample(c(TRUE, FALSE), 1)) {
    y <- c(0, y)
    lineWidthY <- c(0, lineWidthY)
  }
  if(sample(c(TRUE, FALSE), 1)) {
    y <- c(y, height)
    lineWidthY <- c(lineWidthY, 0)
  }

  # plot
  plot(NULL, xlim=c(0, width), ylim=c(0, height), axes=FALSE, frame.plot=TRUE, xlab='', ylab='', xaxs = "i", yaxs = "i")
  # add lines
  abline(v=x, lwd=lineWidthX)
  abline(h=y, lwd=lineWidthY)
  # add colored polygons
  for(i in 1:(length(y))) {
    for(j in 1:(length(x))) {
      randColor <- sample(colors, 1, prob=p) # random color
      k = sample(y[-i], 1)
      l = sample(x[-j], 1)
      polygon(c(x[j], l, l, x[j]), c(y[i], y[i], k, k), col=randColor, border='black', lwd = round(min(width, height)/20))
    }
  }

}

# Runner
par(mfrow=c(1,1), mar=rep(1,4))
composition(fixedLines=TRUE, seed=NA)
Sample random compositions generated using the above R code:


Alternatively, a javascript-based implementation is also available: https://jef.works/mondrian-generator/