Voronoi
Low poly art with Voronoi tessellation
“Low poly art” refers to a style where “simple geometric shapes placed side-by-side to create angular, often minimalist, compositions” remniscent of low polygonal resolution renders in 3D animations. The style can be tedious to create manually, so I attempted to automate generation of such “low poly art” using Voronoi tesslation. A Voronoi tessellation partions a plane into regions, which are inherently just polygons, based on the distances among points in a specific subset of the plane such that for a seed point, its corresponding region consists of all points closer to that seed than to any other.
As a demonstration, we can use the dismo package to generate a Voronoi tesselation from a set of random points.
# install.packages('dismo')
library(dismo)

############# Random points
set.seed(0)
## generate random points
## increase number of points to increase resolution
p <- cbind(runif(1000), runif(1000))
## make voronoi
v <- voronoi(p)
## random rainbow colors
cols <- rainbow(length(v$id), s = 0.8, v = 1)
## plot
par(mfrow=c(1,1), mar=rep(0,4))
plot(v, col=cols[v$id], border=FALSE)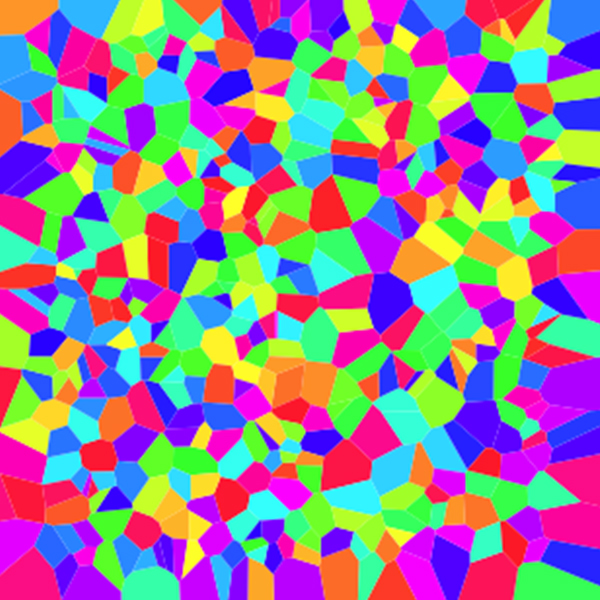
We can color the regions or polygons randomly as shown above, or we can also sample the colors from an image.
############# Borrow colors from image
library(jpeg)
## sample image
img <- readJPEG(system.file("img", "Rlogo.jpg", package="jpeg"))
## map points positions to colors from image
pcol <- do.call(rbind, lapply(1:nrow(p), function(i) {
x <- floor(p[i,1]*(nrow(img)-1))+1
y <- floor(p[i,2]*(ncol(img)-1))+1
col <- rgb(img[x,y,1], img[x,y,2], img[x,y,3], maxColorValue=max(img))
return(c(x, y, col))
}))
## plot original image using points
plot(as.numeric(pcol[,1]), as.numeric(pcol[,2]), col=pcol[,3], pch=16)
## plot voronoi with colors sampled from image
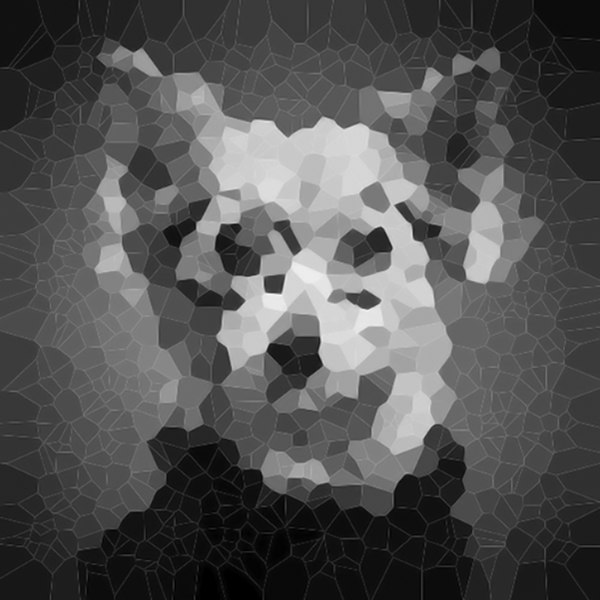
plot(v, col=pcol[,3], border=FALSE) Generated images for different sets of points (of varying density) are shown below.
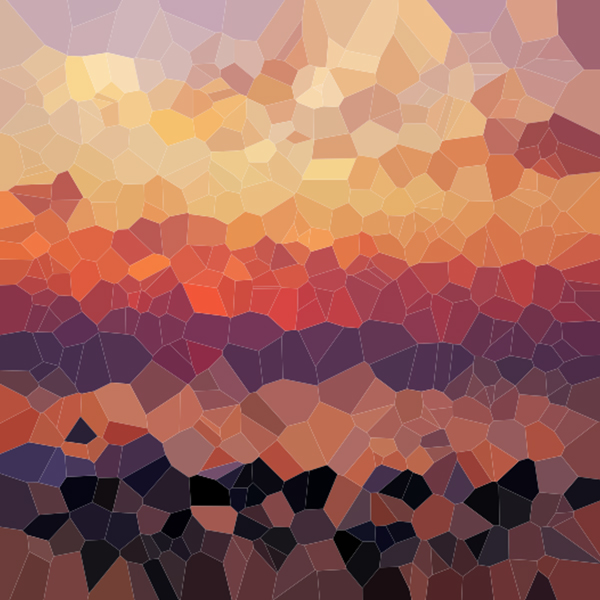
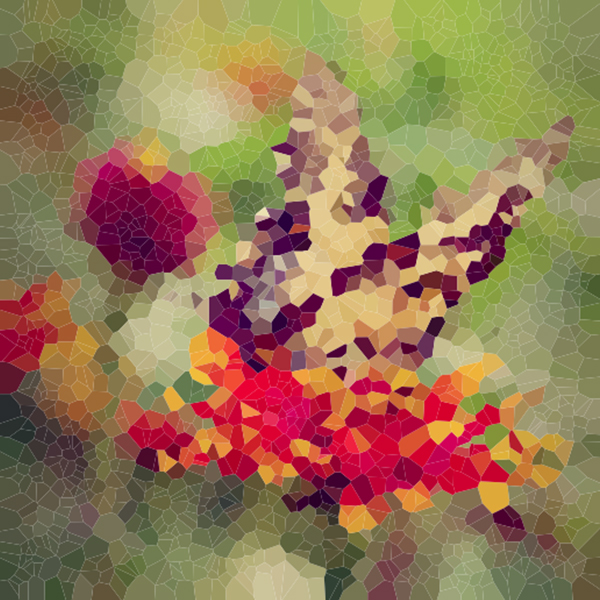
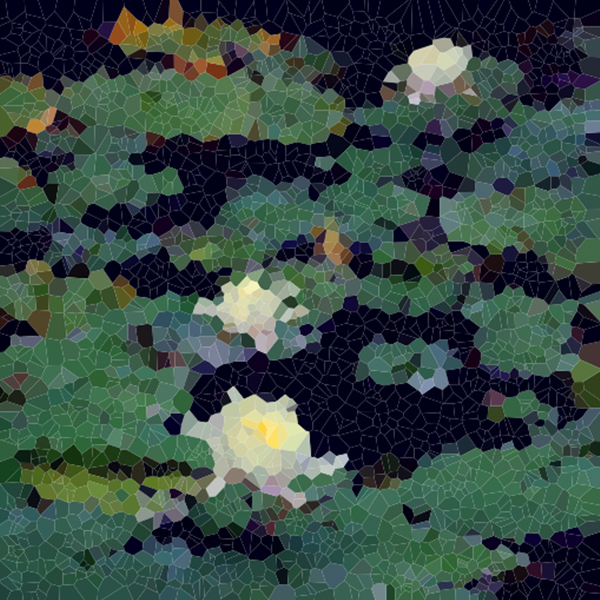
This begins to look more like the ‘low poly’ art style. Additional enhancements can be made by placing points in an image-aware manner, rather than randomly as it is current done. Points can be placed more densely in regions with rapid intensity change (perhaps as quantified by a Laplacian) to ensure regions with high levels of detail are represented by more polygons. This enhancement will be left as an exercise to the reader.